When are my Twitter followers active? And are they active anyway?
It is quite obvious why you would want to know, when your Twitter followers are typically active one Twitter. Because if you share your content at the right time, it has a higher chance to be seen (no body scrolls back the last 2 weeks).
It is also interesting to see how many of your followers are active on any given day, because there might be quite a number of abandoned or maybe even fake accounts amongst you followers.
There are meanwhile online services like Tweriod that can help to to find these things out, but it is much more fun to know and be able to check this out yourself. So let’s do it!
First the results!
This analysis was done for the Twitter account @filingBot which had about 3700 followers at the time of analysis.
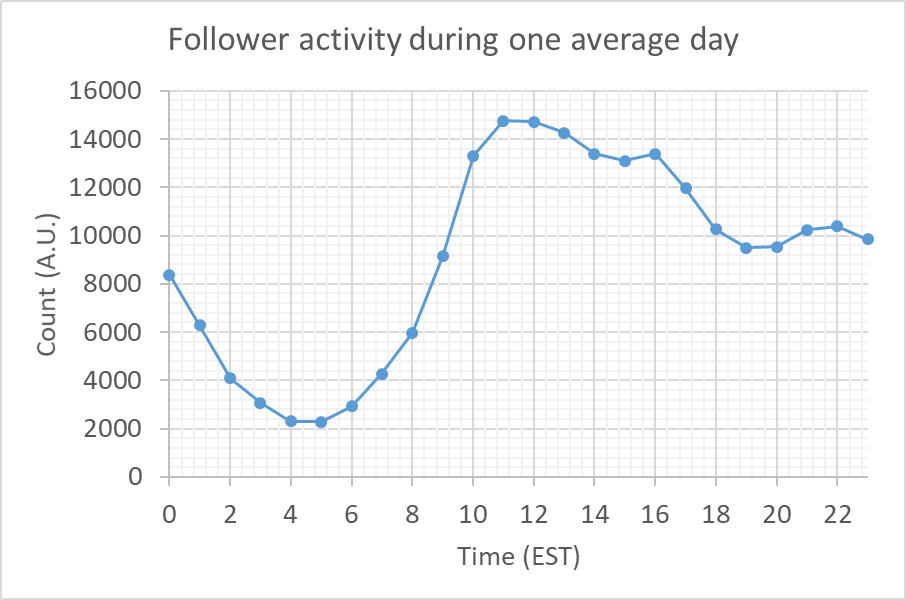
Follower activity during one average day

Between 4am and 5am my followers are the least active (no surprise :-). Peak activity is around early noon time (Tweeting during lunch-break!) and slowly gets less until 4pm. After 4pm activity drops faster and then stays constant throughout the evening.
In conclusion: The followers of @filingBot are most active during trading-hours.
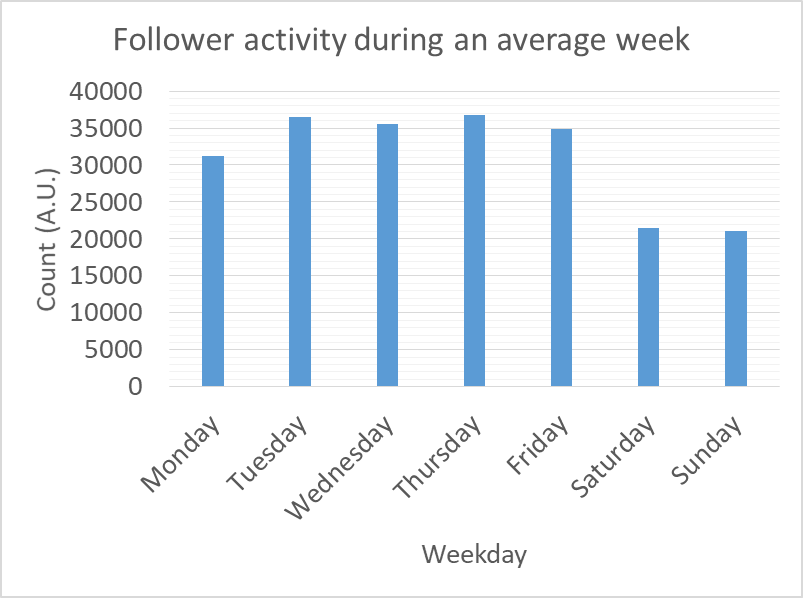
Follower activity during one average week
Now let’s look at the activity during an average week:

The interpretation here is easy: From Monday to Friday followers are almost twice as active as during the weekend. So one can guess that there are better things to do on Saturday and Sunday than hanging out on Twitter.
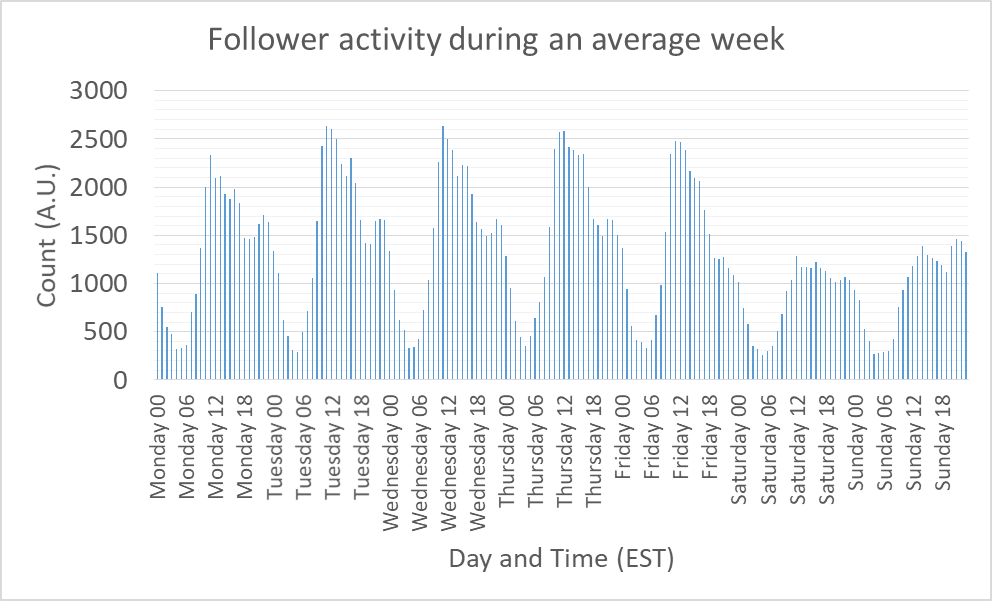
Let’s look at the weekly trend with some finer granularity - by weekday and hour:

As one can see: Monday activity is a bit lower compared to other weekdays and the Friday afternoon drops off faster then the other days. Saturday and Sunday don’t show the typical high activity during working hours.
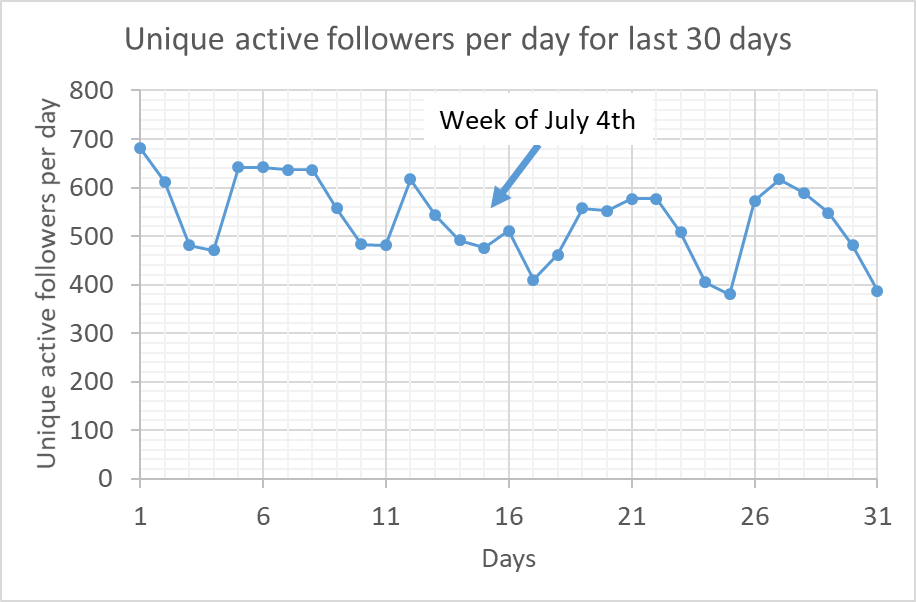
Unique active followers per day for the last 30 days
How many of the followers of @filingBot are actually active on any given day? When this analysis was done @filingBot had approximately 3700 followers. Here are the unique active follower counts per day for the last 30 days:

Conclusion: On any given day between 13% and 17% of the followers of @filingBot are active on Twitter.
Weekends (and the week of July 4th) are visible as dips in the activity count.
So now let’s see how to create such an analysis.
1) Prerequisites
You need to sign-up at the Twitter developer site to get access to the Twitter API. Here is your starting point: Twitter Developer Documentation
Then you can use the asynchronous client library for the Twitter API from npm. In order to use it you need:
- consumer_key
- consumer_secret
- access_token_key
- access_token_secret
2) Get followerIDs
Before we can analyze when our followers are active, we need to first identify our followers. As long as you do not want to analyze more than 5000 followers, this is very straight forward, because you can only retrieve the IDs of up to 5000 followers in one request:
|
|
What you get is an array of the follower IDs as strings. You should use “stringify_ids: true”, because Javascript cannot handle extremely large integer numbers.
Don’t forget to replace “YOUR_TWITTER_HANDLE” with your Twitter handle (aka screen_name) (without @).
I added some lines of code to randomize this array, because by default the returned array should be sorted with your newest followers on top. The additional randomization step helps to get more stable results in case you only analyze a sample selection of all your followers.
I am also using the very new Javascript async await syntax, which is featured in ES2017, because it is nicely supported in node.js now and allows very easy to read code.
3) Get tweets of followers and extract timestamps
The next steps is to get the last tweets of all the followers to analyze and extract the timestamps when these tweets were created:
The Twitter API allows you to retrieve up to the last 200 Tweets from a user in a single request. The last 200 tweets from every user should be a good enough sample size. Since we want to look at the follower activity, we will treat native tweets, replies and retweets equally (exclude_replies: false, include_rts: true).
Again I put this into a small function that returns a Promise which we can then await, thanks to ES2017’s async/await feature.
I am using the very good moment.js library to convert the “created_at” property from the Twitter API response into timestamps we can easily analyze later on. All the tweet timestamps from all followers get collected in one array.
Important is to obey the Twitter API rate limit, which in this case should be one request per second (1000 ms). Also for this I am using async/await.
|
|
4) Analyze timestamps and display data
Once we have build a huge array of timestamps from the last tweets from our followers, we can start to analyze them. There might be more efficient ways to do this, but here is what I came up with:
moment.js comes in very handy for handling weekdays and hours. I split the timestamp array basically into 3 arrays:
- weekdayAndHourArray
- weekdayArray
- hourArray
Then I use an object (hash) to count how often each weekday, hour and so on occurred.
Since objects cannot be sorted, I convert that object (hash) into an array of objects.
Then I sort this array by “time” (propertyName).
And finally I convert this sorted array of objects into a histogram object, which can be displayed easily with ascii-histogram.
|
|
Here is an example of the raw output:
|
|
Miscellaneous
One important thing to note: The timestamps returned by the Twitter API are UTC times. So for interpretation of the results we need to consider the timezone we are in vs. UTC.
If you want, you can also analyze the follower activity of other Twitter users. You just need to change the twitter handle.
Eventually I might put the full source code on GitHub (when I have time).
